Real Estate Market Report - Belmont, CA (Feb, 2024)
Current Market Condition
2
Active Listings
0
Pending Listings
$3,413,000
Median List Price
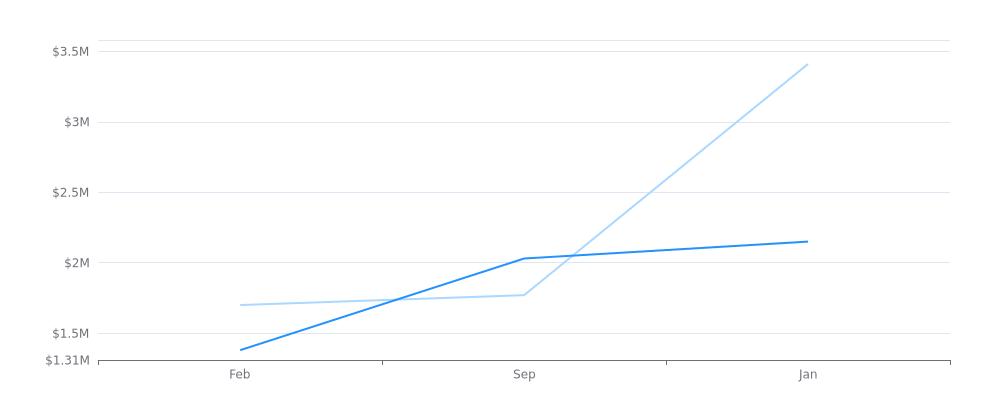
The median sale/list price for one dataset shows a steady increase from $1,697,500 in February 2023 to $3,413,000 in January 2024. The median sale/list price for the other dataset shows a more fluctuating trend, with a low of $1,380,000 in February 2023 and a high of $2,150,000 in October 2023.
Median Sale/List Price
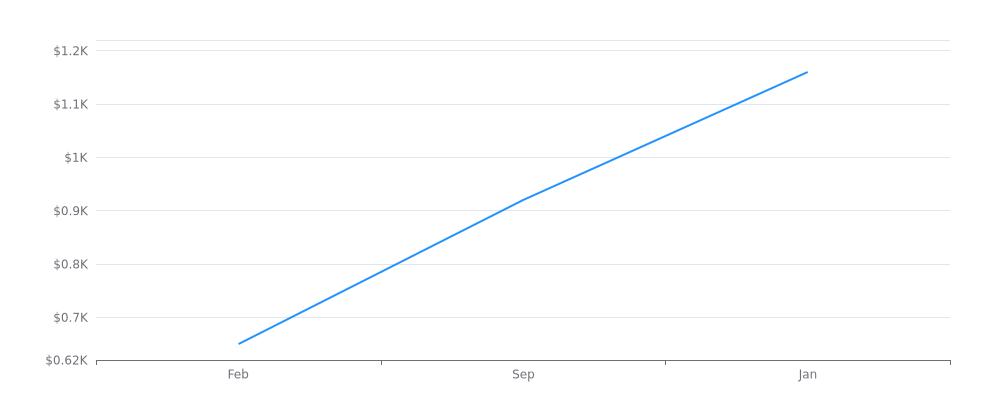
The median sale price per square foot in February 2023 was $654.206, which increased to $923.611 by May 2023 and further rose to $1158.372 by October 2023. This indicates a steady increase in property values over the course of the year.
Median Sale Price per Square Foot
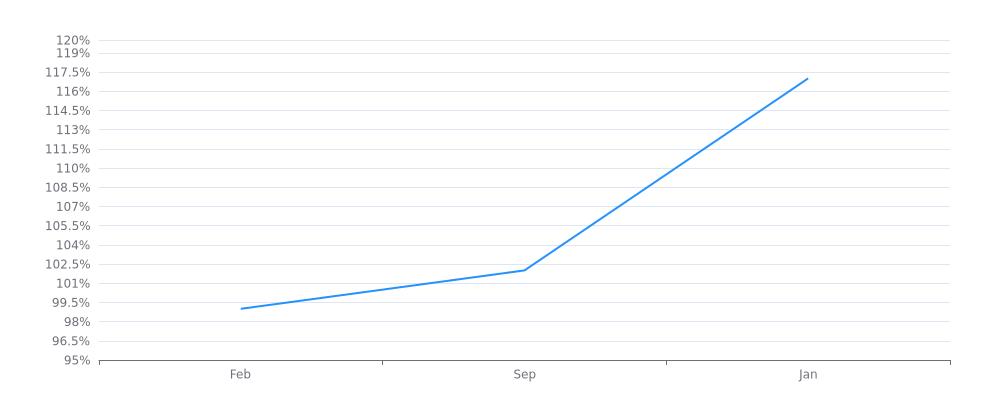
The median sale price to list price ratio in February 2023 was 0.986, indicating that homes were selling slightly below their listed price. By May 2023, the ratio had increased to 1.018, indicating that homes were selling for slightly above their listed price. In October 2023, the ratio jumped up to 1.166, indicating that homes were selling for significantly above their listed price.
Median Sale Price to List Price Ratio
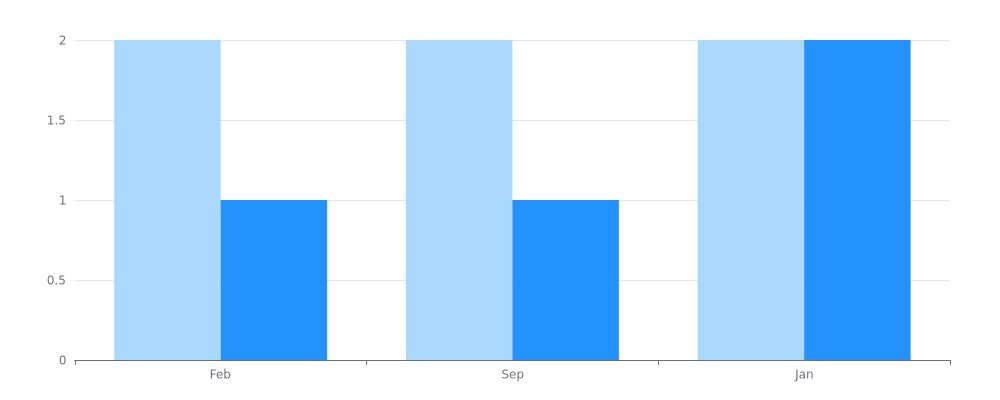
In February 2023, there were a total of 3 properties sold/listed, with an additional 1 property sold/listed in May 2023 and a total of 4 properties sold/listed in October 2023 and January 2024.
Properties Sold/Listed
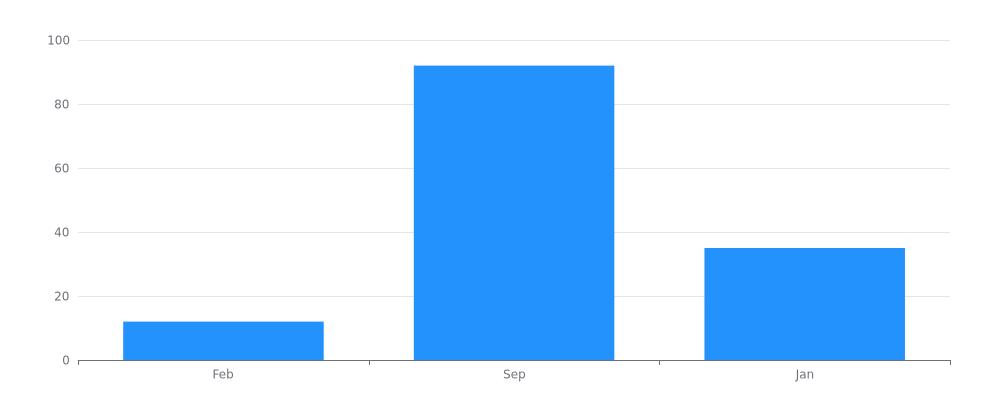
The median days on market for residential properties increased from 12 days in February 2023 to 92 days in May 2023, and then decreased to 35 days in October 2023.
Median Days on Market
Categories
Recent Posts

Priced Out? A Condo or Townhome Could Be Your Way In.

Wisconsin Property Taxes: What Home Buyers in the 920 Actually Need to Know

More Homes, Better Prices: A Buyer’s Summer

14 Years Running: Why Real Estate Is Still America’s Favorite Investment

Think Nobody's Buying Homes Right Now? Think Again.

The “Take It or Leave It” Attitude Is Fading from the Market – What That Means for You

What to Expect at Closing in Wisconsin: A Room-by-Room Guide for 920 Buyers

What To Expect from the Housing Market in the Second Half of 2026

Student Loans Are Back in the News. Don't Let It Put Your Homeownership Plans on Hold.

What Buying or Selling a Home Gives Back to Your Community