Real Estate Market Report - San Francisco, CA (Apr, 2024)
Current Market Condition
1,334
Active Listings
502
Pending Listings
$1,345,000
Median List Price
The median sale/list price data is presented for the period of April 2023 to March 2024. The median sale/list prices for the first dataset ranges from $1,195,000 to $1,450,000 and for the second dataset ranges from $1,250,000 to $1,450,000. Overall, the median sale/list prices show a generally increasing trend with some fluctuations over time.
Median Sale/List Price

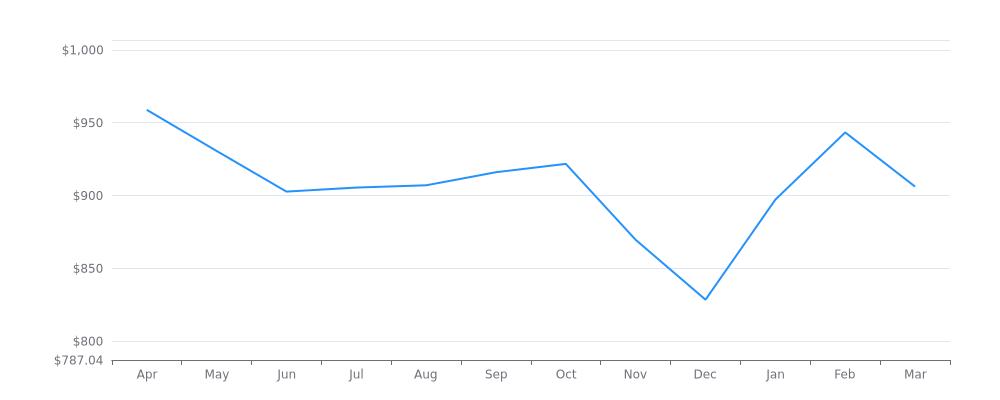
The median sale price per square foot decreased from $958.826 in April 2023 to $902.679 in June 2023, but then started to increase again, reaching $943.307 in February 2024. The lowest point was in December 2023, with a median sale price per square foot of $828.46.
Median Sale Price per Square Foot
The median sale price to list price ratio remained consistent at 1.0 from April to July 2023, but increased slightly to 1.003 in June. There was a drop in the median ratio in December 2023 to 0.989, but it gradually increased to 1.002 in March 2024.
Median Sale Price to List Price Ratio

The first dataset shows that the number of properties sold/listed increased steadily from April 2023 to August 2023 before experiencing a significant surge in September 2023. The trend then fluctuated over the next few months, peaking in January 2024 before decreasing slightly in February and March 2024. The second dataset indicates that the number of properties sold/listed remained relatively stable from April 2023 to June 2023 before experiencing a slight increase in July 2023. The trend then fluctuated over the next few months, peaking in October 2023 before decreasing slightly in November and December 2023. The number of properties sold/listed then decreased significantly from January 2024 to March 2024.
Properties Sold/Listed

The median days on the market for properties sold in the first half of 2023 ranged from 42 to 52 days, with a dip to 40 days in October. However, by January 2024, the median days on the market had increased significantly to 97 days before dropping again to 35 days in February and 37 days in March.
Median Days on Market

Categories
Recent Posts

Buying a Home? Here's What You Should Know About Home Insurance Costs.

Wisconsin Property Taxes: What Home Buyers in the 920 Actually Pay

Home Price Growth Slowed Down. That May Be Changing.

Selling a Luxury House? Here’s Why Now Is a Good Time

The House That Started It All Could Kickstart What's Next

Priced Out? A Condo or Townhome Could Be Your Way In.

Wisconsin Property Taxes: What Home Buyers in the 920 Actually Need to Know

More Homes, Better Prices: A Buyer’s Summer

14 Years Running: Why Real Estate Is Still America’s Favorite Investment

Think Nobody's Buying Homes Right Now? Think Again.